
Frontend Documentation
Overview
The PacketSnitch frontend is an Electron-based desktop application that provides an interactive interface for loading, browsing, and filtering the JSON output produced by the backend (snitch.py). It visualizes packet metadata, payloads, protocol details, and GeoIP information, and supports frontend-driven LLM summaries and packet-context questions through the Electron main process. The frontend also includes a data conversion workspace (Conv), an encryption workspace (Crypt), an aggregate statistics view (Stats), an Internet Heatmap worldmap, a sortable packet list (List), an encrypted local key and credential store (Keystore), a session notes workspace (Notes), and a persistent activity log (Log).
Requirements
- NodeJS 16.4+
- Electron Forge 7.11+
- Dependencies:
- electron-forge
- webpack
- fs-extra
- electron-squirrel-startup
- copy-webpack-plugin
- ollama
Loading Data
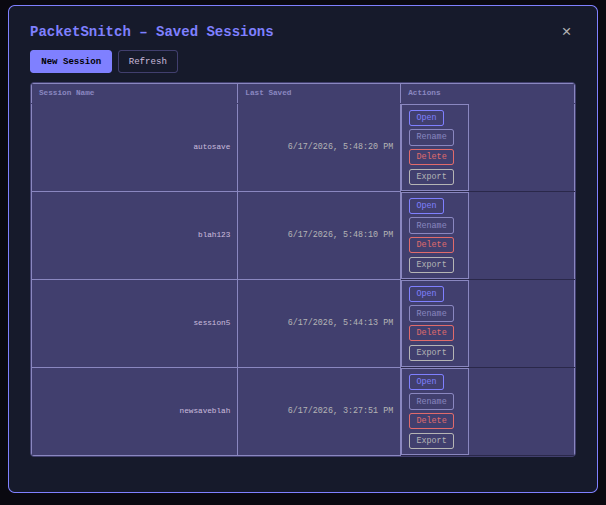
- Click Load JSON to open either a backend
hosts.jsoncapture or a previously saved PacketSnitch session file. - Click Load PCAP to run the backend directly on a
.pcapfile from within the app. - Toggle Use LLM to enable or disable the current runtime LLM workflow before running. This checkbox is seeded from Settings → LLM → LLM active by default.
Output Frames
The PacketSnitch UI is divided into several panels that together provide a full view of each captured packet.
Left Sidebar
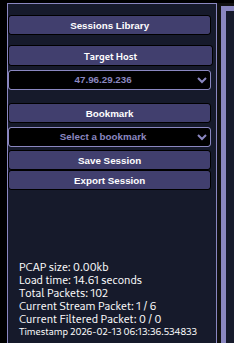
The left sidebar contains navigation controls and file metadata.
| Element | Description |
|---|---|
| Target Host | Dropdown to select which host/IP stream to inspect. Changing the host resets the filter and loads that host’s packets. |
| Bookmarks | Save and recall specific packet positions within a session. |
| Save Session | Export the loaded capture with UI session state (packet cursor, filters/history, tabs, bookmarks, and session keychain) as JSON. |
| PCAP size | File size of the loaded .pcap in human-readable format. |
| Load time | Time taken to parse and load the JSON data. |
| Total Packets | Total number of packets in the loaded dataset. |
| Filtered Packets | Number of packets currently matching the active filter expression. |
| Timestamp | Capture timestamp of the currently displayed packet. |
Toolbar / Tab Bar

The toolbar at the top of the content area contains navigation and view-switching controls.
| Control | Description |
|---|---|
| Analysis | Switch to the Summary Frame to view the frontend-generated LLM analysis report and appended stream-context findings. |
| Host Data | Switch to the packet data view (Packet Info + Payload panes) for the currently selected host. |
| Conv | Open the data conversion workspace for translating between hex, binary, base64, ASCII, and decimal, with MIME detection, entropy analysis, and protocol decoding. |
| Crypt | Open the encryption workspace for inspecting encountered SSL/TLS sessions, loading certificates and private keys, and accessing PGP/OpenSSH workspaces. |
| Keystore | Open the local credential store for managing session and persistent keychain entries (passwords, keys, certificates, cookies). |
| Stats | Show capture-level aggregate statistics (protocols, hosts, ports, MIME types, GeoIP locations, etc.) derived from the full loaded dataset. |
| List | Show all packets in a searchable, sortable, stream-groupable list view. |
| Notes | Open the session notes workspace for creating, editing, color-tagging, and exporting freeform notes tied to the current session. |
| Settings | Open the settings workspace for General defaults, LLM defaults and diagnostics, Debug map and transport toggles, and Backend bridge controls. |
| Log | Toggle the Activity Log panel, which records all GUI and backend actions with timestamps. |
| Prev / Next | Navigate backwards and forwards through the packet list (or filtered set). |
| Filter bar | Enter a filter expression to narrow the displayed packets (see Filtering). |
When right-clicking in packet/data views, PacketSnitch shows a context menu with shortcuts to copy text and payload views, load/derive/decompress conversion values into Conv, follow bidirectional streams into Conv or Crypt, manage keystore entries, build filter expressions (including link/transport/application protocol filters), export packet/Conv outputs, interact with HTTP file bodies, and run LLM context actions. See context-menu.md for full details.
Summary Frame
The Summary Frame displays the LLM-generated analysis report for the loaded capture. This frame is shown by clicking the Summary button in the toolbar.
Recent behavior updates:
- The summary content now uses a preformatted text view for better readability of longer model output.
- Summary generation is stream-aware: when packet navigation settles, the frontend schedules a follow-up summary for the active stream after the configured idle delay and appends non-duplicate findings.
- LLM requests are issued through the Electron main process (
ollama:generateIPC), which applies the configured model, bearer token, timeout, and token cap. - Existing summary text is persisted in saved sessions and restored on load.
Packet Info Pane
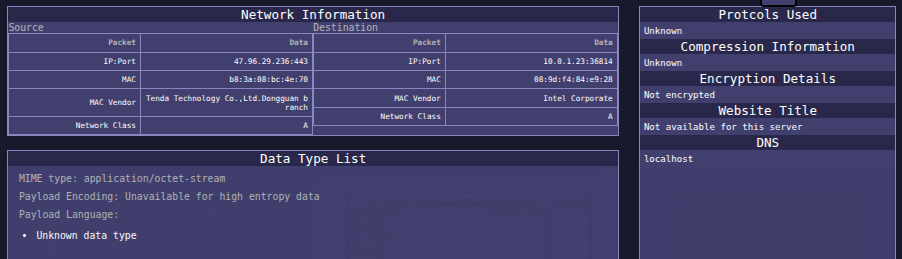
The Packet Info Pane is the main left-centre panel. It displays structured metadata for the currently selected packet, broken into several sub-sections.
IP-to-IP Routing
Displays source and destination IP addresses in a src → dst format for quick identification of the packet flow.
Network Information
Shows source and destination protocol/port details, including the ICANN service name and port description for the destination port.
Data Type List
Lists the detected MIME type, character set, content encoding, and magic-identified data types found in the payload.
Active Recon
Populated only when the backend was run with the -a (active recon) flag. Contains:
| Sub-section | Description |
|---|---|
| Protocols Used | Identified application-layer protocols for the packet. |
| Compression Information | Whether the payload is compressed and the detected compression method. |
| Encryption Details | SSL/TLS version and cipher information if applicable. |
| Website Title | HTML page title fetched from the destination host. |
| DNS | Resolved hostnames from reverse DNS lookup. |
Packet Payload Pane

The Packet Payload Pane sits below/beside the Packet Info Pane and displays the raw payload bytes for the current packet.
ASCII View
Displays consecutive runs of printable ASCII characters extracted from the payload. Non-printable bytes are skipped, making it easy to spot human-readable strings embedded in binary data.
Hex Grid
An interactive hex dump of the full raw payload. Clicking a cell in the hex grid highlights the corresponding bytes and displays any printable ASCII sequence starting at that offset in the ASCII view.
Conv Tab (Data Conversion)
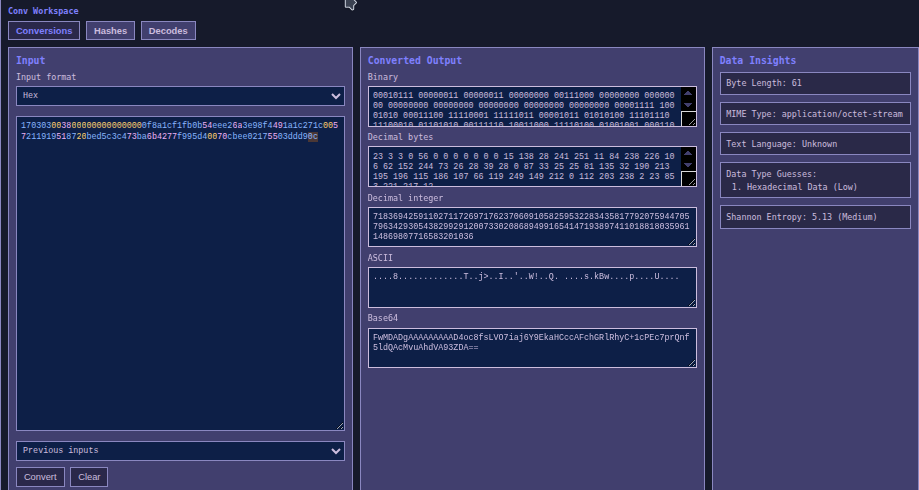
The Conv tab is a self-contained data conversion workspace accessible at any time by clicking Conv in the toolbar. It has three sub-tabs: Conversions, Hashes, and Decodes.
Conversions Sub-tab
Input
| Control | Description |
|---|---|
| Input format | Choose the encoding of the text you are pasting: Base64, Binary, Hex, ASCII / UTF-8, or Decimal bytes. |
| Input textarea | Paste raw encoded data here (hex strings, base64 blobs, binary sequences, etc.). |
| Previous inputs | Dropdown history of previous Conv inputs for the current session; select an entry to reload it. |
| Convert | Parse the input according to the selected format and populate all output fields. |
| Clear | Erase the input and all output fields. |
Converted Output
After clicking Convert, the following representations are shown simultaneously:
| Field | Description |
|---|---|
| Hex | Hexadecimal encoding of the input bytes. |
| Binary | Binary bit-string encoding. |
| Decimal bytes | Space-separated decimal byte values. |
| Decimal integer | The input interpreted as one big-endian integer. |
| ASCII | Printable ASCII / UTF-8 representation. |
| Base64 | Standard base64 encoding. |
Data Insights
| Field | Description |
|---|---|
| Byte Length | Total number of bytes represented by the input. |
| MIME Type | Magic-byte inferred MIME type of the data. |
| Text Language | Detected natural language of the content (when the data is text). |
| Data Type Guesses | Up to three ranked guesses for the semantic data type (e.g. JWT Token, bcrypt Hash, Base64 Encoded Data) with a match confidence (High / Medium / Low, where High means a strong structural match). |
| Shannon Entropy | Shannon entropy value (0–8 bits/byte) and qualitative label: Low (< 4.5), Medium (4.5–6.8), High (> 6.8). |
Hashes Sub-tab
The Hashes sub-tab computes cryptographic hash digests of any input text. Type or paste text into the Hashed Input field; hashes are computed automatically and displayed in read-only fields below.
| Hash output field | Algorithm |
|---|---|
| MD5 | MD5 (128-bit) |
| SHA-1 | SHA-1 (160-bit) |
| SHA-256 | SHA-256 (256-bit) |
| SHA-384 | SHA-384 (384-bit) |
| SHA-512 | SHA-512 (512-bit) |
| SHA3-256 | SHA-3 / Keccak-256 |
| SHA3-512 | SHA-3 / Keccak-512 |
| RIPEMD-160 | RIPEMD-160 |
| Whirlpool | Whirlpool (512-bit) |
The Hashed Input field accepts escape sequences (\n, \r, \t, \\, \xNN) so exact byte sequences can be hashed without pasting raw binary data. Clicking Convert on the Conversions sub-tab also populates the Hashed Input field automatically from the current conversion input bytes.
Decodes Sub-tab
The Decodes sub-tab is a protocol decoder. Select a protocol from the Protocol dropdown (Auto-detect, HTTP, Telnet, SSH / OpenSSH, POP3, IMAP, SMTP, SIP) to attempt to parse the current conversion input bytes as that protocol and display a human-readable decoded view below.
The context menu can populate Conv from selected/context data, payload bytes, cursor ASCII, decompressed Conv input, HTTP body bytes, or full followed stream data. See context-menu.md for details.
Packet JSON Sub-tab
The Packet JSON sub-tab is just the full JSON structure that PacketSntich uses in memory to tell you about the packets. Every piece of information about a singular packet that the application is aware of, lives here. This pane is also Context Menu “context-aware”, meaning you can right click on an item in the JSON, and easily send it to other places within the PacketSnitch.
Note: If this data looks similar to the hosts.json data, it should, as that is where this data comes from, almost verbetum.
Crypt Tab (Encryption Workspace)
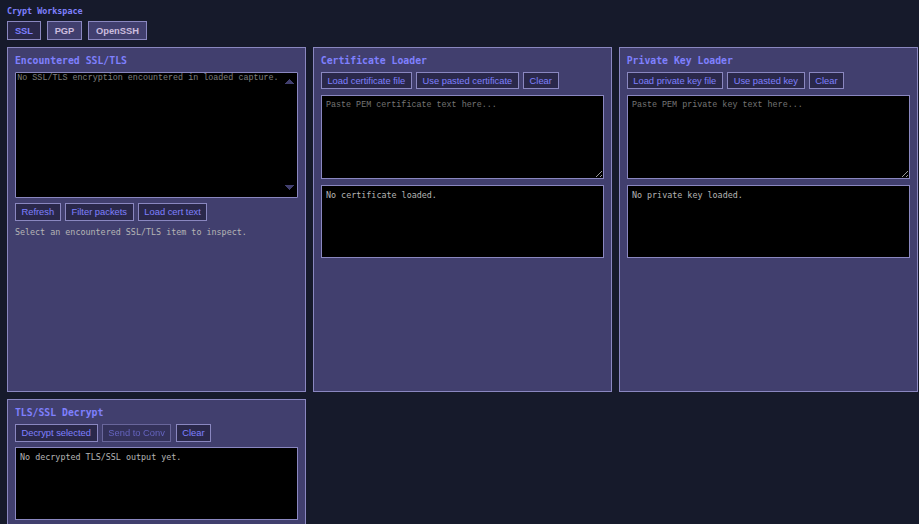
The Crypt tab provides a multi-panel workspace for inspecting cryptographic material encountered in a capture or loaded from files. It has three sub-tabs: SSL, PGP, and OpenSSH.
SSL Sub-tab
| Panel | Description |
|---|---|
| Encountered SSL/TLS | A list of all distinct SSL/TLS sessions detected in the loaded capture. Select an entry to view its details (SSL version, cipher, certificate text). Buttons: Refresh (re-scan the loaded data), Filter packets (populate the filter bar to show only packets in the selected session), Load cert text (copy the session certificate into the Certificate Loader). |
| Certificate Loader | Load a PEM certificate from a file (Load certificate file) or paste PEM text directly (Use pasted certificate). A parsed preview is shown below the input. Clear removes the loaded certificate. |
| Private Key Loader | Load a PEM private key from a file (Load private key file) or paste PEM text directly (Use pasted key). A parsed preview is shown below. Clear removes the loaded key. |
| TLS/SSL Decrypt | Attempt RSA decryption of the selected SSL/TLS session’s payload using the loaded private key. Decrypt selected runs the attempt; the decrypted bytes (hex and ASCII preview) are shown in the output pane. Send to Conv loads the decrypted payload as hex into the Conv tab. Clear clears the decryption output. |
PGP Sub-tab
The PGP workspace is a fully implemented OpenPGP inspection and decrypt/verify tool.
| Panel / Action | Description |
|---|---|
| PGP Messages In Capture | Scans loaded packet payloads for ASCII-armored PGP blocks and lists them by packet/path. Refresh re-runs the scan. Load selected copies the current block into the working input area. |
| PGP Input | Accepts either ASCII-armored OpenPGP text or binary hex. Analyze identifies the structure type (message, signature, public key, private key, cleartext signed message). To ASCII armor and To binary hex convert between formats. |
| Passphrase candidates | Packet text and metadata are mined for password/passphrase hints and offered as selectable candidates for decryption attempts. |
| Private / Public key inputs | Optional ASCII-armored private key for decrypt operations and public key for signature verification. |
| Decrypt / Verify | Uses openpgp in the renderer to decrypt messages or verify cleartext signed messages. Successful output is rendered as UTF-8 text, and verified/decrypted state is summarized. |
| Send output to Conv | Pushes decrypted/verified text into Conv for further conversion or protocol decoding. |
Successful decrypt/verify operations can also store validated PGP private key/passphrase material into the session keystore for later reuse.
OpenSSH Sub-tab
Reserved workspace for future OpenSSH key and session tooling. For now, PacketSnitch can still recognize SSH/OpenSSH material in Conv decode/detection flows.
Settings Tab
The Settings tab is a persistent configuration workspace with four sub-tabs: General, LLM, Debug, and Backend.
Settings are stored locally at ~/.config/packetsnitch/config/settings.json (Linux) or C:\User\Username\AppData\Roaming\packetsnitch\config\settings.json (Windows).
General Sub-tab
| Setting | Key | Description |
|---|---|---|
| Theme | general.themeId |
Selects the active UI theme from discovered JSON theme files. |
| Conv JSON indent spaces | general.convJsonIndentSpaces |
Number of spaces used when rendering packet JSON in Conv. |
| Status reset delay (seconds) | general.statusResetSeconds |
Delay before transient status text is reset. |
| Default backend packet chunk size | general.backendPacketChunkSize |
Fallback chunk size used when backend progress metadata is unavailable. |
| Backend worker threads | general.backendWorkerThreads |
Number of parser worker threads requested from the backend bridge. |
| Stream warning threshold (packets) | general.streamContextWarnPacketThreshold |
Warns before loading large follow-stream results into Conv or Crypt; default 20, minimum 5. |
| Manual Conv import limit (MB) | general.manualConvImportMaxBytes |
Maximum allowed size for context-menu manual file imports into Conv (default 2 MiB). |
Allowed backend chunk sizes are fixed to: 25, 100, 250, 500, 2000.
The Settings UI also shows the runtime themes directory path so custom theme JSON files can be dropped in place and loaded.
LLM Sub-tab
| Setting | Key | Description |
|---|---|---|
| Ollama model | llm.ollamaModel |
Model used for summary generation. |
| Ollama API key | llm.ollamaApiKey |
Optional bearer token for authenticated Ollama endpoints. |
| Set LLM Active by default | llm.activeByDefault |
Controls whether LLM-powered frontend features are active by default (load-screen toggle, stream summaries, and LLM context-menu actions). |
| LLM trigger delay (seconds) | llm.triggerDelaySeconds |
Idle delay before stream-context summaries run while navigating packets. |
| Max tokens for stream summary | llm.maxSummaryTokens |
Maximum generated summary size (num_predict). |
| LLM request timeout (seconds) | llm.ollamaRequestTimeoutSeconds |
Timeout applied to Ollama request headers and body reads. |
| LLM retries | llm.retryCount |
Number of retry attempts after an LLM request fails. |
If the API key field is left blank when saving, the currently stored key is retained.
The LLM panel also exposes runtime diagnostics for local install status, daemon reachability, cloud API reachability, and the last call result code.
Debug Sub-tab
| Setting | Key | Description |
|---|---|---|
| Enable ungrouped list virtualization | debug.ungroupedListVirtualizationEnabled |
Experimental rendering optimization for large ungrouped packet tables. |
| Enable backend HTTP data mode | debug.backendHttpDataModeEnabled |
Streams incremental capture snapshots over the backend HTTP response instead of relying on temporary hosts-*.json files. |
| Map projection zoom X / Y | debug.mapProjectionZoomX, debug.mapProjectionZoomY |
Horizontal/vertical calibration for the Internet Heatmap basemap projection. |
| Map projection offset X / Y | debug.mapProjectionOffsetX, debug.mapProjectionOffsetY |
West/east and north/south alignment offsets for the worldmap overlay. |
Backend Sub-tab
| Setting | Key | Description |
|---|---|---|
| Default backend packet chunk size | general.backendPacketChunkSize |
Default chunk size used for incremental frontend progress when backend metadata is incomplete. |
| Backend worker threads | general.backendWorkerThreads |
Worker-thread count passed to the backend parser. |
| TCP host | backend.tcpHost |
Hostname/IP used for backend HTTP service mode. |
| TCP port | backend.tcpPort |
Port used for backend HTTP service mode. |
| Force legacy backend spawn | backend.forceLegacySpawn |
Disables HTTP service mode and launches the backend process per capture run. |
Actions
- Save settings: normalizes and persists General, LLM, Debug, and Backend values.
- Restore defaults: resets settings to app defaults.
- Theme changes are applied immediately after save.
Theme Engine Summary
- Themes are JSON files in
packetsnitch/themes. - Default bundled themes are mirrored there automatically on startup.
- Theme definitions provide CSS variable overrides and optional custom logo data.
See themes for complete theme schema, variable reference, logo setup, and opacity tuning.
Stats Tab
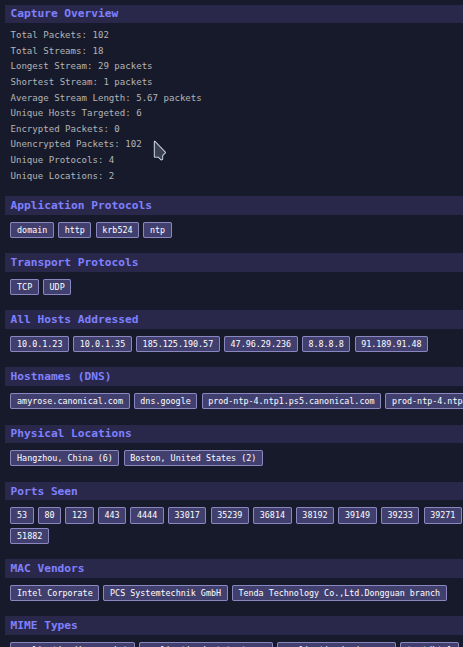
The Stats tab shows aggregate statistics computed across the entire loaded capture (all hosts, all packets). Statistics are presented as labelled tag-cloud sections. Clicking any tag pre-fills the filter bar with a suggested filter expression for that value.
| Section | Description |
|---|---|
| Capture Overview | Total packet count, unique hosts targeted, encrypted vs. unencrypted packet counts, unique protocol count, unique GeoIP location count, total traffic bytes, and current credentials-found count. |
| Top Talkers | Top IP addresses by packet participation (source + destination). Clicking a talker applies an IP src/dst filter query. |
| Application Protocols | All distinct application-layer protocol names identified by port (e.g. HTTP, DNS, SMTP). |
| Transport Protocols | Transport layer protocols seen (TCP, UDP, ICMP). |
| All Hosts Addressed | All unique source and destination IP addresses and target host values. |
| Hostnames (DNS) | Resolved hostnames from DNS or reverse-lookup data. |
| Physical Locations | City/country pairs from GeoIP with occurrence counts, sorted by frequency. Unlike other sections, location tags are display-only and do not generate a filter query when clicked. |
| Ports Seen | All source and destination port numbers observed. |
| MAC Vendors | Ethernet MAC vendor strings identified from OUI lookup. |
| MIME Types | All distinct MIME types found in payload data. |
| Data Types | All distinct magic-identified data type strings. |
| Carvable Files | Candidate files detected from HTTP/FTP/NFS/SMB streams. Clicking a tag loads that carved file directly into Conv. |
Internet Heatmap / Worldmap
The Stats tab also includes an Internet Heatmap worldmap view for public GeoIP locations.
| Control / Element | Description |
|---|---|
| Aggregate By | Switch between plotting the entire capture or only the packets currently returned by the active filter. |
| Intensity By | Weight heatmap intensity by packet count or payload bytes. |
| Map Zoom | Zooms the basemap and overlays without changing the underlying plotted coordinates. |
| Intensity / Point Size / Tightness / Blur | Adjusts the heatmap rendering characteristics and overlay spread. |
| Location points | Clickable projected points representing grouped public GeoIP coordinates. Useful for focusing or highlighting a region. |
| Heatmap summary | Reports how many geolocated internet hosts are currently represented and the active packet/byte total for the chosen scope. |
Private/local addresses are intentionally excluded from the worldmap.
List Tab
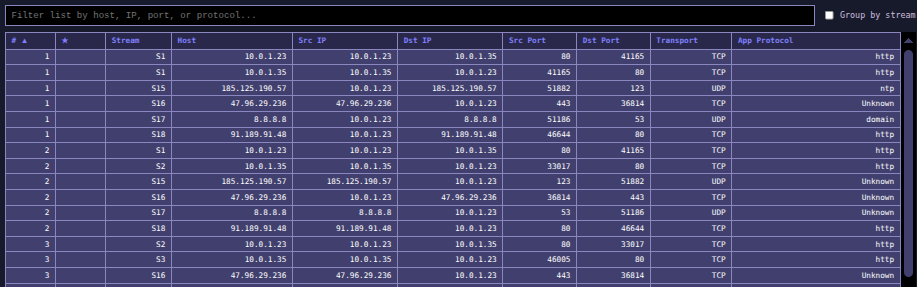
The List tab shows all packets across all hosts as a searchable, sortable table.
Search Bar
| Control | Description |
|---|---|
| Filter list | Text input that filters rows in real time by host, IP address, port number, or protocol name. |
| Group by stream | When checked, rows are grouped by bidirectional stream (same IP/port pair, same transport) before applying the sort column, making it easy to follow a single conversation. |
Columns
| Column | Description |
|---|---|
| # | Packet index from the capture. |
| ★ | Bookmark indicator — filled for bookmarked packets. |
| Stream | Stream group number (S1, S2, …) assigned by bidirectional endpoint pair. |
| Host | Target host label from the loaded JSON. |
| Src IP | Source IP address. |
| Dst IP | Destination IP address. |
| Src Port | Source port number. |
| Dst Port | Destination port number. |
| Transport | Transport protocol (TCP / UDP / ICMP). |
| App Protocol | Application-layer protocol name inferred from port. |
Click any column header to sort by that column; click again to reverse direction. Click any row to navigate to that packet in the Host Data view.
LLM and Backend Bridge
Frontend LLM behavior now lives in the renderer and Electron main process rather than in the Python parser itself.
LLM Flow
- Renderer code decides when to call the model based on runtime settings and local Ollama availability.
- Requests are sent through
window.llmapi.generate(...)to the Electron main-processollama:generateIPC handler. - The main process applies the configured model, optional bearer token, timeout, and
num_predicttoken cap before calling the Ollama Node client. - Failed requests can be retried automatically according to the configured retry count.
- LLM-backed features currently include the Summary view, stream-context follow-up summaries, and the Explain this Packet… context-menu submenu with Explain this data…, Ask PS a question…, and Summarize this packet….
Backend Bridge Modes
- HTTP service mode: initializes a long-lived backend service, probes
GET /ping, posts capture work toPOST /process, and sends control actions throughPOST /control. - Service metadata can be queried through
GET /version, and runtime parser settings can be updated throughPOST /control(set-runtime-config) without restarting the backend service. - HTTP data mode: when enabled, the backend can stream NDJSON progress plus in-memory snapshot payloads back to the renderer.
- Legacy spawn mode: fallback per-run process launch path used when the service is unavailable or explicitly disabled.
Keystore Tab (Local Keychain)
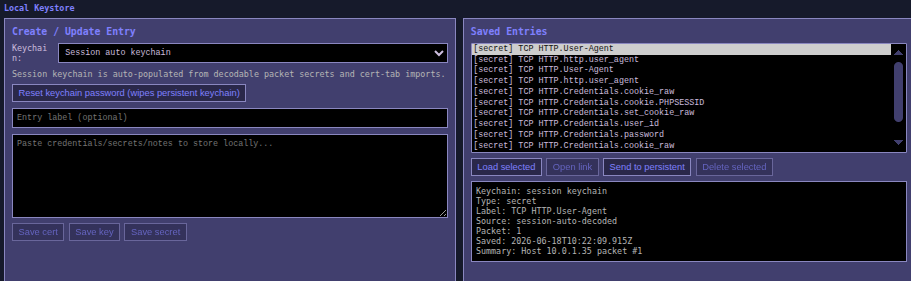
The Keystore tab provides a local encrypted credential store. It has two keychains: a Session keychain (in-memory only, reset when the app closes) and a Persistent keychain (encrypted with AES-GCM, stored in IndexedDB, and unlocked with a passphrase each session).
First-time setup
On first use, clicking Keystore or adding an entry to the persistent keychain opens the Set Keychain Password dialog. Enter and confirm a password (minimum 8 characters). This password encrypts all persistent entries; it is never stored in plain text.
On subsequent launches, the Unlock Keychain dialog prompts for the password before revealing persistent entries.
Create / Update Entry
| Control | Description |
|---|---|
| Keychain | Choose whether new entries are saved to the Session auto keychain or the Persistent keychain. |
| Reset keychain password | Wipes all persistent keychain entries and sets a new encryption password. A confirmation prompt is shown before proceeding. |
| Entry label | Optional human-readable name for the entry. |
| Content area | Paste the credential, secret, certificate, or notes to store. |
| Save cert | Store the pasted content as a certificate entry (enabled only in Persistent keychain mode). |
| Save key | Store the pasted content as a private key entry (enabled only in Persistent keychain mode). |
| Save secret | Store the pasted content as a generic secret/password entry (enabled only in Persistent keychain mode). |
Saved Entries
| Control | Description |
|---|---|
| Entries list | Scrollable list of all saved entries in the currently selected keychain. |
| Filter keystore entries | Session-keychain-only live filter that matches entry type, label, and content. |
| Load selected | Copy the selected entry’s content into the Create/Update area for inspection or editing. |
| Open link | Open the selected entry’s content as a URL in the system’s default browser. Only enabled when the entry contains a valid http:// or https:// URL. |
| Send to persistent | Promote a session keychain entry to the persistent keychain (enabled only in Session mode). |
| Delete selected | Permanently remove the selected entry (enabled only in Persistent keychain mode). |
| Details preview | Shows the type, label, source, creation timestamp, and a content summary of the selected entry. |
Auto-population
PacketSnitch automatically populates the Session keychain from packet data when a capture is loaded:
- HTTP form credential fields (usernames, passwords) extracted by the backend.
- Cookie/Set-Cookie header values extracted from HTTP payloads.
These auto-entries appear with a source of session-auto and can be promoted to the persistent keychain via Send to persistent.
Manual URI/URL Entry
The context menu’s Add to Keystore… → Manual URI options open a dialog to manually enter any http:// or https:// URL. The entered URL is saved as a url type entry in the selected keychain. Entries of this type can be opened directly in the system browser via Open link. See context-menu.md for more on keystore context menu options.
Notes Tab
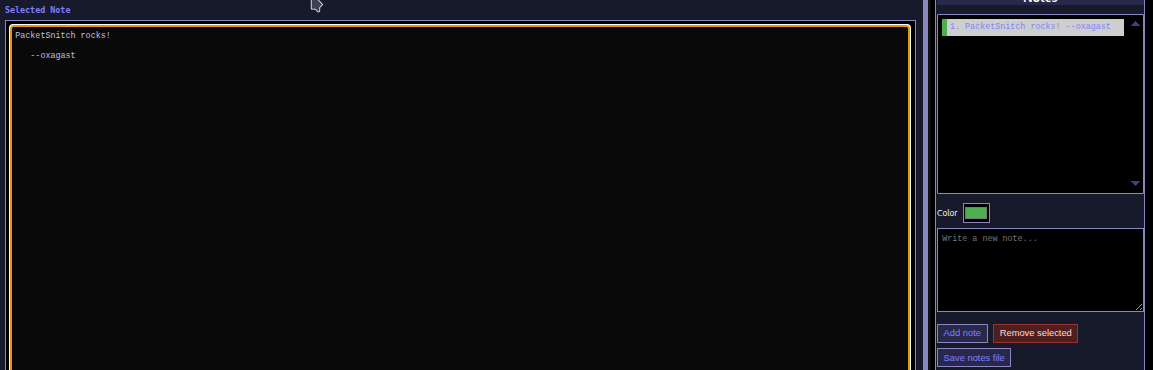
The Notes tab is a session notes workspace for creating and editing freeform text notes tied to the current session. Click Notes in the toolbar to open it.
Notes Sidebar (right panel)
| Control | Description |
|---|---|
| Notes list | Scrollable list of all notes in the current session, each prefixed with its position number and a preview of its text. Notes are color-coded by their assigned color. |
| Color picker | Color swatch used when creating a new note, and updated to show the color of the currently selected note. |
| New note input | Text area for composing the body of a new note before adding it. |
| Add note | Creates a new note from the New note input text with the selected color and adds it to the top of the list. |
| Remove selected | Permanently removes the currently selected note from the list. |
| Save notes file | Exports all current notes to a plain-text file on disk (Save dialog). Each note is separated by a --- divider. |
Notes Editor (main area)
The main content area shows a full-width editable text area for the currently selected note. Edits are reflected immediately in the notes list preview. The editor is disabled when no note is selected.
The Notes workspace also includes a sanitized live Markdown preview for the selected note, including GitHub-style pipe tables.
Notes Context Menu
Right-clicking in packet or Conv views while notes are active shows a Send to Notes… submenu. See context-menu.md for details on context menu items.
Notes are saved as part of the session file when Save Session is used.
Log Tab
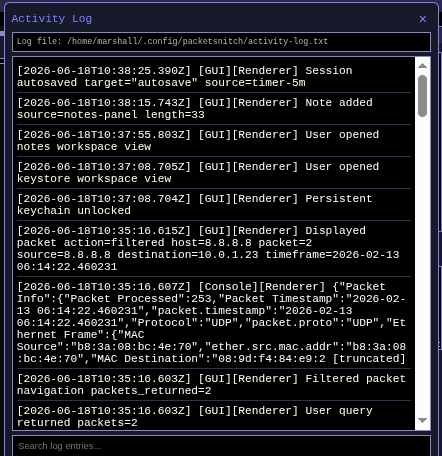
Clicking Log in the toolbar toggles the Activity Log panel, which slides in from the bottom of the window. The log records all significant GUI actions, backend events, and console output with ISO 8601 timestamps.
Log Entry Formats
| Prefix | Description |
|---|---|
[GUI][UI] |
User interactions and UI state changes (tab switches, file loads, filter runs, etc.). |
[Console][UI] |
Console log output captured from the renderer process. |
[Console][Backend] |
Error messages forwarded from the Python backend process. |
The log is written to a persistent log file on disk. The file path is shown at the top of the log panel.
Log Search
The Search log entries input filters the visible entries in real time (case-insensitive substring match). The log file on disk is not modified by the search.
Right Sidebar (Datagram Frame)
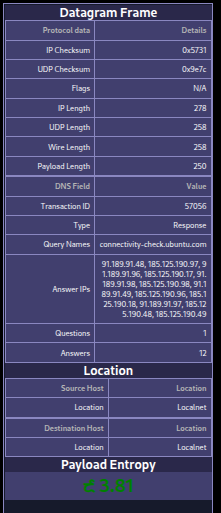
The right sidebar provides three contextual data panels that update with each packet.
Datagram Frame
A protocol-specific table of lower-level packet fields. The table content varies depending on the detected protocol:
| Protocol condition | Fields shown |
|---|---|
| All packets | Checksum fields (IP checksum, TCP/UDP/ICMP checksum) |
| DNS (UDP/TCP port 53) | Transaction ID, QR flag, query names, answer names, answer IPs, record counts |
| SNMP (port 161/162) | SNMP version, community string, PDU type |
| DHCP (port 67/68) | Message type, transaction ID, client IP, offered IP, server IP |
| NTP (port 123) | Leap indicator, version, mode, stratum, reference ID |
| SIP (port 5060/5061) | Message type, method/status, URI, From, To, Call-ID |
| HTTP (port 80/443/8080/8443) | Request/response type, method, URL, status code, headers (host, server, content-type, etc.) |
Location
Displays a GeoIP table for the source and/or destination IP addresses, including country, city, postal code, and time zone. For local-network addresses, shows a Localnet indicator.
Payload Entropy
Visualizes the Shannon entropy of the payload as a numeric value and graphical indicator. High entropy typically indicates encrypted or compressed content; low entropy suggests plain text or structured data.
Filtering

Packets can be filtered using an expression in the filter bar. The syntax is:
attribute:value
attribute:value==<val>
attribute:value>=<val>
Multiple conditions can be combined using && (AND), || (OR), and parentheses for grouping:
ip.src.addr:192.168.1.1 && tcp.dst.port:443
(payload.mime:text/html || payload.mime:application/json) && payload.entropy>=4.0
Filter keys use the same dot-notation names as the searchable attributes documented in the Backend docs. Keys are normalized to lowercase with spaces replaced by hyphens.
The filter history dropdown merges session filter history with user-saved named filters. Right-clicking the filter input lets you save the current query with a label (or remove an exact saved match) via an in-app dialog.
Filter Examples
| Expression | Description |
|---|---|
ip.src.addr:10.0.0.1 |
Packets from source IP 10.0.0.1 |
tcp.dst.port:443 |
TCP packets to port 443 |
ip.dst.addr:10.0.2.* && transport.proto:tcp |
TCP Packets destined for the subnet 10.0.2.0/24 |
payload.entropy>=7.0 |
Payloads with entropy ≥ 7.0 (likely encrypted/compressed) |
payload.mime:text/html |
Payloads identified as HTML |
loc.src.country:China |
Packets originating from China (GeoIP) |
dns.qname:example.com |
DNS queries for example.com |
http.method:POST |
HTTP POST requests |
tcp.flags:SYN |
Packets with the SYN flag set |
snmp.community:public |
SNMP packets using the public community |
ip.src.addr:10.0.0.1 && tcp.dst.port:80 |
Source 10.0.0.1 to destination port 80 |
(tcp.dst.port:80 | | tcp.dst.port:443) && payload.entropy>=6.0 |
HTTP/HTTPS with high-entropy payloads |
License
GPL v3
Author
Marshall Whittaker